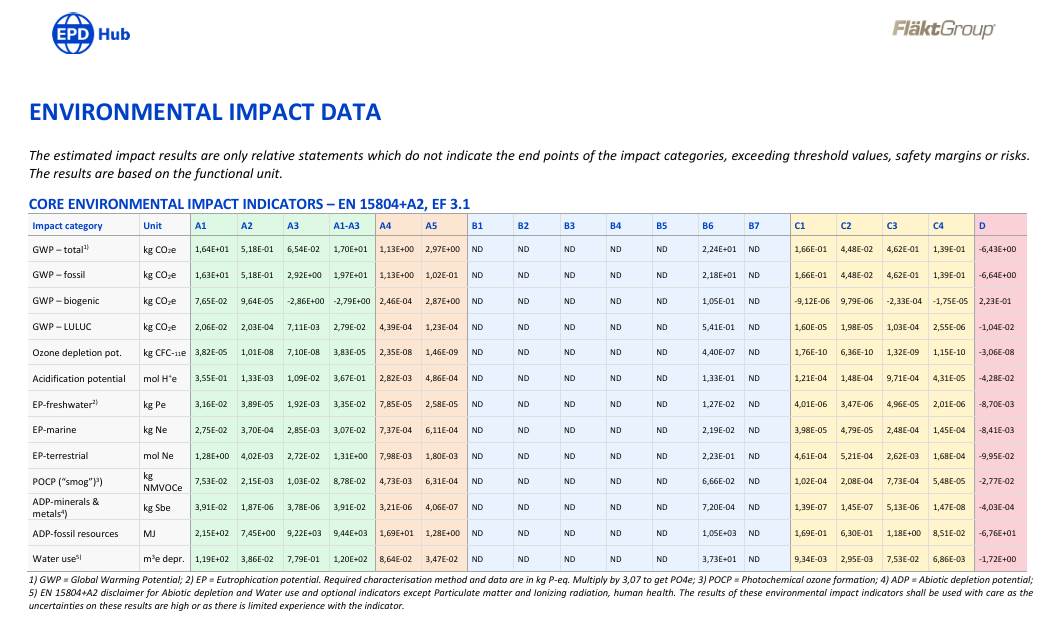
Il est également important d’examiner les hypothèses, les sources de données et les limites indiquées dans le document, car les fabricants peuvent adopter des approches différentes selon les caractéristiques du produit, les méthodes de production et l’usage prévu. Ces informations sont essentielles non seulement pour interpréter les résultats de l’ACV, mais aussi pour garantir leur cohérence avec les standards internes de reporting en matière de durabilité.
En se concentrant sur les étapes pertinentes du cycle de vie et sur des unités de référence cohérentes, il est possible d’identifier rapidement les informations utiles pour prendre des décisions éclairées en matière de conception et d’achat.
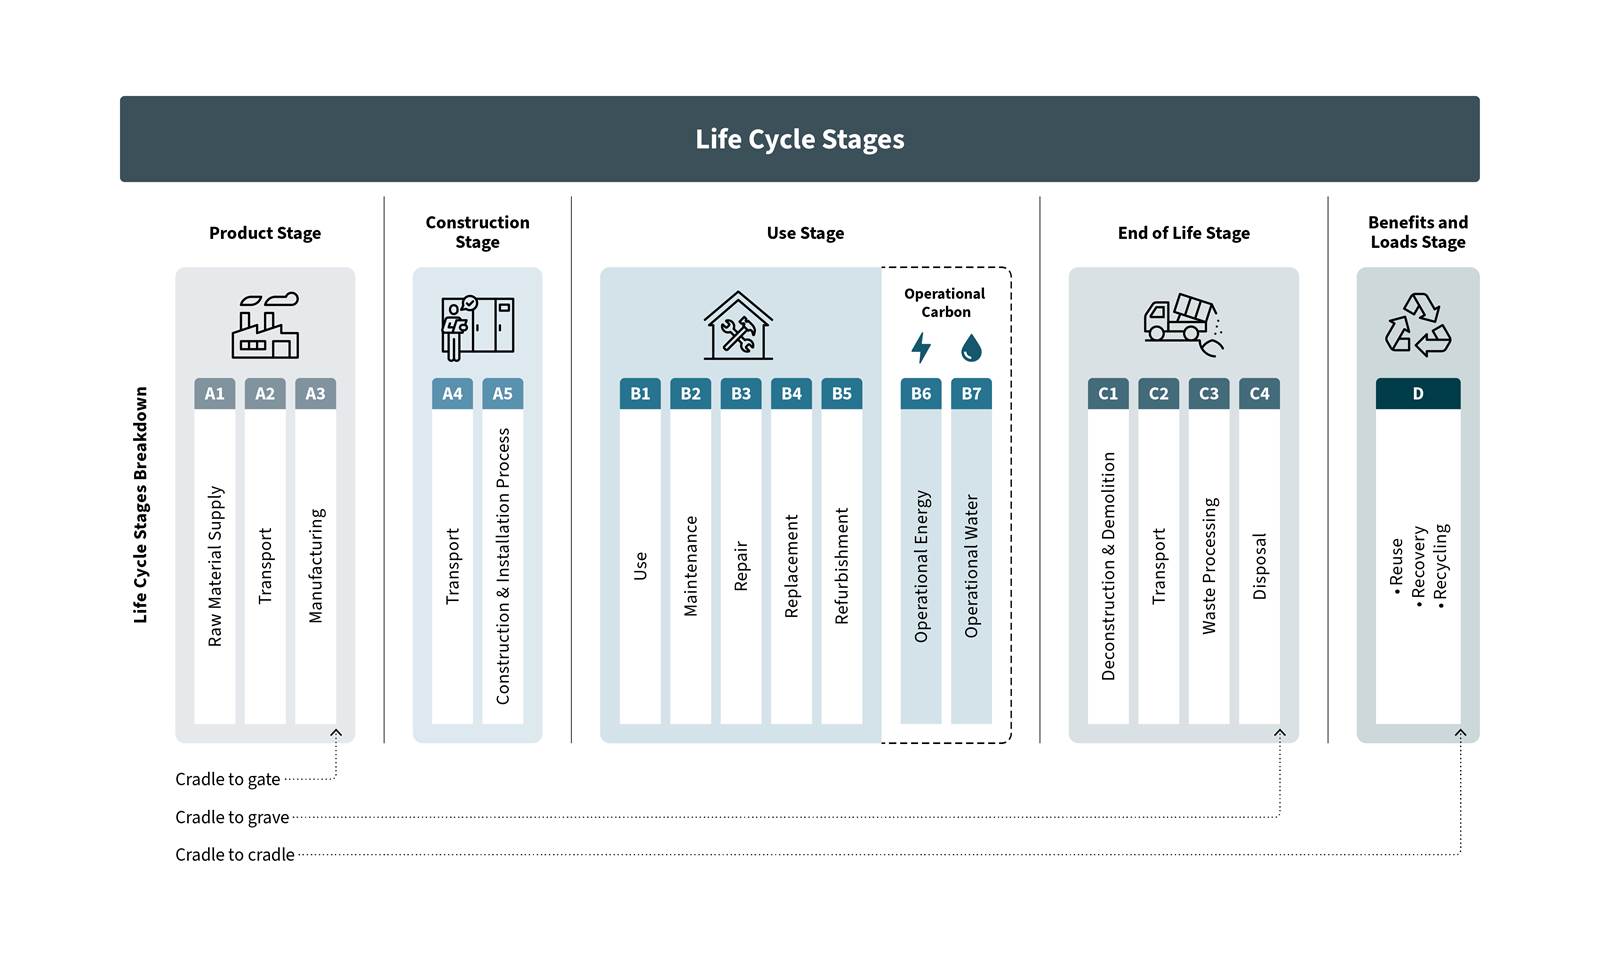
Plongeons maintenant dans le cycle de vie d’un produit, décomposé en plusieurs modules pour mieux comprendre les différentes étapes de son existence.
L’étape du produit et du processus de construction (A1–A5)
A1–A3: L’impact environnemental de la fabrication
- A1 – Approvisionnement en matières premières : extraction et transformation des matériaux.
- A2 – Transport : acheminement des matières premières vers le site de production.
- A3 – Fabrication : consommation d’énergie, consommation d’eau et processus de production.
Ces étapes sont essentielles pour comprendre l’impact des choix de matériaux et l’efficacité des processus de production. Elles reposent généralement sur des données primaires provenant des fournisseurs et des sites de production, tandis que les étapes suivantes sont souvent modélisées à partir de scénarios d’analyse du cycle de vie reconnus.
A4–A5: Transport et installation
- A4 – Transport jusqu’au chantier
- A5 – Installation, y compris les matériaux auxiliaires et la consommation d’énergie lorsque cela est pertinent.
Ces modules prennent en compte les impacts liés à l’acheminement du produit jusqu’au chantier et à son installation.
Lorsque le produit entre en service (B1–B7)
B1–B5: Utilisation, maintenance, réparation et remplacement
Ces sous-modules couvrent les impacts liés à l’utilisation normale du produit, à la maintenance courante, aux réparations, au remplacement des composants qui ne couvrent pas toute la durée de vie de référence et, lorsque cela s’applique, à la rénovation.
Ils permettent notamment d’illustrer comment la durabilité du produit, les besoins de maintenance et la durée de vie des composants influencent sa performance environnementale au fil du temps.
B6 : Consommation d’énergie en phase d’utilisation
Le module B6 couvre la consommation d’énergie pendant la durée d’utilisation du produit. Pour les systèmes CVC, cette phase représente souvent la part la plus importante des impacts sur l’ensemble du cycle de vie.
Lors de l’interprétation des résultats, il est essentiel de prendre en compte à la fois la durée de vie de référence et l’unité fonctionnelle.
Exemple : deux produits ayant la même consommation énergétique quotidienne, mais des durées de vie différentes, présenteront des impacts totaux différents dans le module B6. Le produit ayant la durée de vie la plus longue peut présenter un impact total plus élevé, mais lorsqu’il est rapporté à une base annuelle, il constitue souvent le choix le plus durable, car les impacts liés à sa fabrication sont répartis sur une période d’utilisation plus longue.
B7: Consommation d’eau en phase d’utilisation
Le module B7 couvre la consommation d’eau pendant la phase d’utilisation, lorsque celle-ci est pertinente pour le produit.
Le chapitre final (C1–C4)
Le module C couvre les impacts environnementaux liés à la fin de vie du produit, notamment le démontage, le transport des déchets, leur traitement et leur élimination finale (sous-modules C1–C4).
Les impacts de ce module sont fortement influencés par le choix des matériaux et les scénarios de fin de vie. Les matériaux pouvant être réutilisés ou recyclés permettent généralement de réduire les impacts environnementaux, tandis que la mise en décharge ou l’incinération sans récupération d’énergie augmente la charge environnementale globale.
Une conception favorisant la circularité et un choix pertinent des matériaux sont donc essentiels pour réduire les impacts liés à la fin de vie.
Module D : Bénéfices et charges au-delà des frontières du système
Le module D prend en compte les bénéfices ou charges environnementaux potentiels au-delà des frontières du système, notamment liés à la réutilisation, au recyclage ou à la récupération d’énergie.
Ces résultats sont présentés séparément des modules A à C et mettent en évidence la valeur potentielle des matériaux et ressources récupérés dans le développement d’une économie circulaire.
Pourquoi les comparaisons entre EPD ne sont pas toujours simples
Bien que les EPD soient conçues pour assurer la transparence, la comparaison directe de produits provenant de différents fabricants peut être complexe. Pourquoi ?
- Différentes unités de référence (par exemple, par produit ou selon une performance donnée sur une période définie)
- Différentes frontières du système et différents scénarios d’utilisation
- Différentes versions de la norme EN 15804 (A1 et version mise à jour A2)
Par exemple, les impacts environnementaux peuvent être exprimés selon différentes unités de référence. Certaines EPD rapportent les impacts à un niveau de performance donné sur une durée de vie définie, tandis que d’autres les rapportent par unité de produit.
Même lorsque les produits remplissent une fonction similaire, ces différences peuvent rendre les comparaisons directes trompeuses, car elles ne reflètent pas nécessairement le même niveau de performance ou le même service rendu.
De plus, les fabricants peuvent utiliser des scénarios d’utilisation différents ou appliquer des choix méthodologiques différents pour la phase d’utilisation.
La standardisation des EPD étant encore en évolution, ces différences sont fréquentes et peuvent limiter la fiabilité des comparaisons entre fabricants. À mesure que le cadre et les normes relatifs aux EPD continueront d’évoluer, une plus grande cohérence et une meilleure comparabilité des données sont attendues.
D’ici là, les EPD doivent être interprétées avec précaution et dans leur contexte spécifique, plutôt que d’être utilisées comme un outil de classement ou pour comparer directement des produits de différents fabricants.